Computer vision is an innovative field of research that aims to provide computers with an understanding of digital imagery, often through artificial intelligence. By applying machine learning to imagery, computers can acquire the ability to interpret text, recognize faces, and even determine aircraft models on airfields.
Many of these applications rely on machine learning structures known as neural networks. In particular, computer vision greatly benefits from a type of neural network that performs a function known as convolution.
In a previous post, we described the internal workings of simple neural networks and defined tabular data, where two values or points represent any number of predefined things (e.g., height and weight, force and acceleration, or gross income and taxes paid).
In this post, we explore image data and how it differs from tabular data. We also get acquainted with convolution in neural networks, a function at the heart of every modern neural network that processes imagery.

What Is an Image?
In computing terms, an image is an array or grid of pixels. Each pixel has a brightness value in one or more colors. Pixels in a grayscale image have a single brightness value. Those in color images have some combination of brightness values for red, green, and blue.
Figure 1 shows a cropped image taken from the MNIST dataset, a popular set of handwritten digits used for training image processing models. It has been enlarged to show the individual pixels.
This grid of pixels is represented inside the computer, on disk or in memory, as a grid of numbers. The numbers are typically integers, ranging from 0 (darkest, no brightness) to 255 (brightest) when using standard, 8-bit imagery.
Figure 2 shows the same image as Figure 1 but with the pixel brightness values overlaid.
How Is an Image Different From Tabular Data?
In many ways, images and tabular data are quite similar. In the context of computing, both images and tabular data consist of grids of numbers. Likewise, much of what happens inside a neural network with imagery is similar to what occurs with other forms of input data: Layers transform the data into useful features, and other layers interpret those model-generated features. Training neural networks consists of trying to find internal parameters to improve the model’s output.
But there are important differences between images and tabular data. At a high level, the major difference between tabular data and image data is shape. After all, tabular data is a one-dimensional list of values; each row in a table is a datum. Images, on the other hand, are grids of values—either two-dimensional grids for grayscale images or three-dimensional grids for color images (where each image has a set of two-dimensional grids for each of the three color channels).
Tabular data can also contain many different kinds of values. Depending on the dataset, the columns can contain integers, decimal numbers, text, or any combination of these types. The grid of an image can only consist of (non-negative) integers.
While both of these differences are important, perhaps the greatest difference is whether or not the order of the components of a datum matters.
Consider a row of tabular data, such as a credit card purchase in a spreadsheet.

If the columns are permuted, or reordered, then no information is lost as long as the headers are similarly permuted. Users can switch around the columns for the transaction date, the posted date, the vendor, and the price without losing any meaning. The order doesn’t matter—even though a trained model may require consistency and expect data to be fed in the same order every time.
Imagery is quite different. The relative locations and brightness of an image’s pixels convey its content.
If you were to permute the locations of the pixels in an image, you’d remove its meaning. The only similarity to the original would be the quantity of bright pixels—the overall brightness of the image.
Figure 3 shows the result of permuting the pixels of Figure 1. While the content of Figure 1 is quite clear, the content of Figure 3 is not.
Why Can’t We Treat an Image Like a Special Case of Tabular Data?
In our blog post about tabular data, the data we discussed were vectors—values with both magnitude and direction. We then scored those vectors against a learned reference vector, effectively measuring how similar the data was to the reference data.
We could follow a similar process when working with images by initially flattening them into vectors while maintaining a map of which pixel goes where in the vector. However, this strategy suffers from a serious setback: It is sensitive to very small translations—horizontal or vertical shifts of even a pixel or two. This can cause major errors when neural networks try to identify the content in images as it forces the neural network to focus on where in the image the content appears, rather than the more important aspect—its shape.
Figure 4 shows an example of one such small translation, where the image was moved down four pixels. To a human viewer, these two images clearly represent the same digit; to a standard neural network, they may not.

If the learned vector against which we score a new image has been trained on the left image above, it may have learned to recognize a boundary between the second and third rows of pixels. As we can see, the second row is mostly black (zero brightness) whereas the third row is mostly bright (with values of 150 or greater).
Unfortunately, in the right image, both the second and third rows are entirely black, with no boundary between them. As a result, the right-hand image will be scored very differently by our neural network.
By treating the image like a vector, we overemphasize where the boundary lies (between the second and third rows), and we lose track of the important feature: that a horizontal boundary exists at all.
For our neural network to be effective at computer vision, what we need is a method to detect critical features wherever those features appear in the image. Convolution is the solution.
What Is Convolution?
Convolution can be defined mathematically, but the easiest way to understand the process is to see it in action.
The key component of convolution is a kernel. A kernel is a learned feature of a neural network that can be matched to a particular feature an image may or may not contain, such as a horizontal line, a vertical line, a corner, etc. Typical neural networks have many thousands of kernels, each trained to match a particular feature. Training neural networks involves determining which kernels, or features they represent, are best able to differentiate the images comprising the training data.
In contrast to scanning an entire image at once, convolution involves applying this small, focused kernel across sequential locations around an image.
Figure 5 illustrates the process of convolution. In this figure, the kernel is represented by a three-by-three purple box and a purple vector (arrow). The purple vector represents the reference feature encoded in the kernel, and the box represents the portion of the image that is currently being scored against the kernel. The green vector (arrow) represents the image’s local feature at the location of the box. For each location, we score the present feature (green arrow) against the reference feature (purple arrow) in the same way we did in our previous post.
Kernel sizes may vary as there are no theoretical limits to their sizes. In most standard image models, the kernels are either three pixels by three pixels, as illustrated, or five by five.
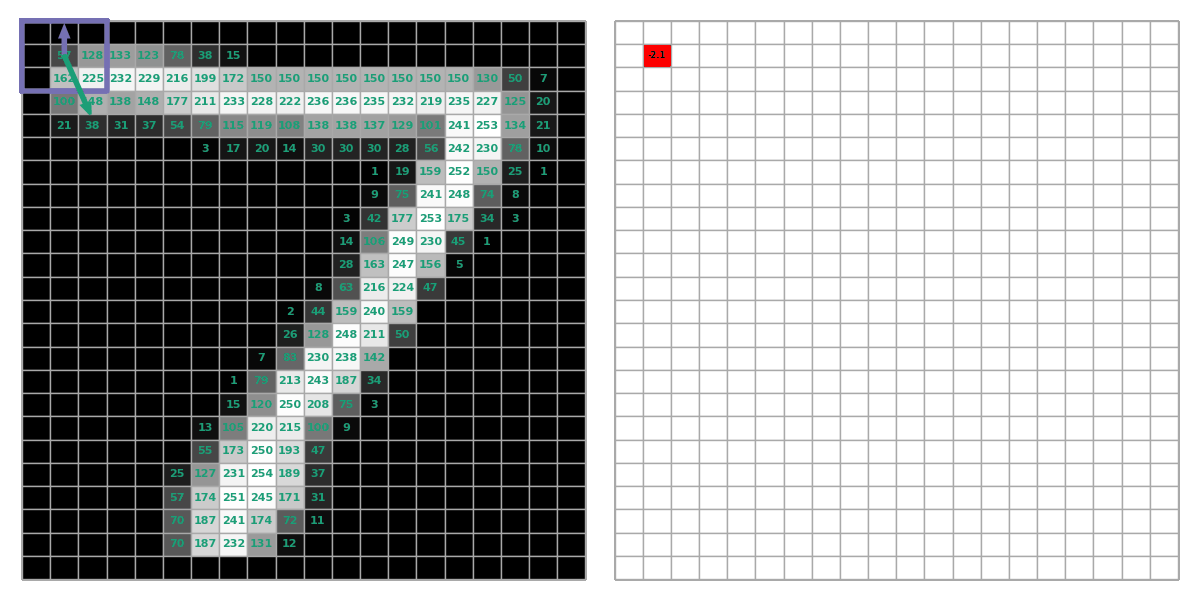 Figure 5: The process involved in applying convolution: Each location is scored against the kernel (purple vector).
As in our previous post on neural networks working with tabular data, we’re scoring the data locally—the difference is that we’re now doing it many times all over the image.
That score is then recorded in its own grid (right), which captures the location in the image where that feature was or wasn’t detected.
What Are Convolutional Neural Networks?
As previously discussed, a neural network is a sequence of functions, or layers, that transform data into useful features and score those features. Convolution is one function used by neural networks to transform data into useful features.
When a neural network’s sequence of functions, or layers, includes convolution, we call that network a convolutional neural network (CNN).
For convolution, a single kernel represents a single feature that the model can learn. As with our tabular data, where we might learn multiple features in a single layer—represented by multiple vectors against which to score data—a convolutional layer can and usually does learn multiple features, represented by multiple kernels.
Like their non-convolutional counterparts, CNNs require non-linear layers between successive convolutional layers. Otherwise, the multiple convolutions are mathematically equivalent to a single convolution with different kernels.
The possibilities for the exact architecture of CNNs are endless and will be discussed in a future post.
Conclusion
Images are a grid of numbers. While you can flatten an image into a vector and treat it like tabular data, the result is generally bad: Models become overly sensitive to the exact location of objects and less sensitive to the shape of the objects.
Convolution allows models to learn important local features, and it searches for those features throughout an image; it also desensitizes models to the location of the features in an image.
While the idea is simple, the endless possibilities for architecture make finding good architectures a challenge. A lot of effort in the research community has gone into finding good architectures with new models published frequently.
For imagery, convolution is the essential tool that makes every state-of-the-art neural network work.
Want to train and deploy computer vision models built on a CNN (and keep them working in a low-code environment)? Schedule a demo today.