This blog post is part of a series on geospatial analysis. View the other posts here:
The Earth is a pool of data 197 million square miles across. Oceans and land, roads and rivers, buildings and borders, farmlands and forests—geographical features contain vital information that describes our world and the events happening in it. This geospatial data, or geodata, is an incredible resource that organizations can use to optimize their decisions about land use, disaster response, military interventions, and more—if people understand what it means.
This is where geospatial analysis comes in.
In broad terms, geospatial analysis is the process of understanding the relationships among features on the Earth’s surface. By exploring geodata, analysts can discover powerful insights about locations, objects, distances, changes over time, and other factors of the natural and built environment.
First arising with the development of geographic information systems (GIS) in the 1960s, geospatial analysis is now a critical part of many fields—mining, forestry, construction, agriculture, defense, utilities, government, and many more.
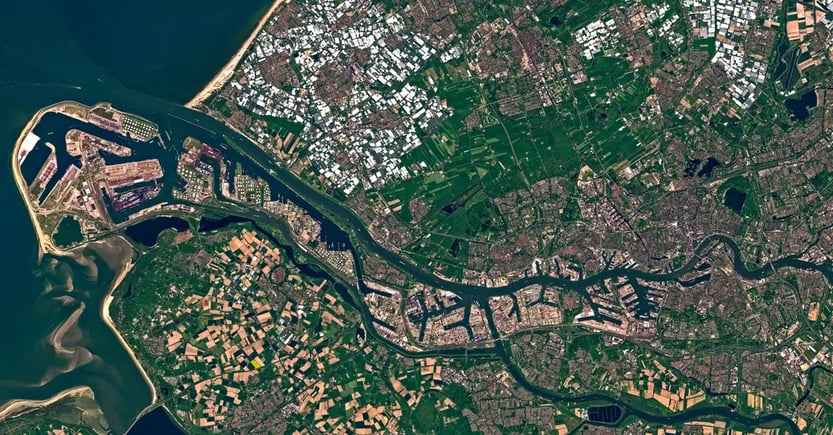
The above satellite image shows the port of Rotterdam, Netherlands. Satellite imagery is a cornerstone data type used in geospatial analysis.
How Does Geospatial Analysis Work?
Traditionally, geospatial analysis begins by bringing data about the physical world into a digital workspace, such as ArcGIS from Striveworks' partner Esri. The vast majority of this data is overhead imagery—frequently satellite imagery, but aerial photography from airplanes and drones is also common.
Once data from one or more sources are available, GIS technicians get to work. Using tools in their software, they can explore, mark up, and perform calculations that start simple but build toward sophisticated insights. For any project, technicians may:
- draw polygons around interesting features or objects
- identify boundaries between land masses
- annotate objects with labels, coordinates, or other metadata
- measure distances between points of interest, such as mountains and seashores
- calculate the midpoint of several important locations
Technicians share their analyses in reports that have monumental consequences. Their research is directly involved in decisions that affect the world around us—from selecting the location of a new park to choosing the right evacuation path for people escaping a flood.
Because of the nature of geospatial data, insights are usually expressed as maps. But charts, graphs, videos, and creative visualizations all prove effective in helping decision makers get a bird’s-eye view of factors in their environment.
What Types of Data Contribute to Geospatial Analysis?
For geospatial analysis, satellite imagery is often a critical data input.
Various organizations keep satellites in orbit around the Earth that routinely collect high-resolution imagery of the planet’s surface and make it available to end users, including industry leaders Maxar, Planet, and Capella Space. This imagery data may consist of full-color visible photography, infrared imaging, or even synthetic-aperture radar (SAR). When brought into an analyst workspace, this imagery sets the foundation for the insights that GIS technicians produce. Many teams generate critical information using satellite imagery alone.
Of course, geospatial analysis benefits from integrating other forms of data with satellite imagery. Additional data that can augment analyst work include…
- topography data
- municipal addresses
- vector data (points, lines, and polygons)
- census data
- mobile telecommunications signals
- social media text and location data
What Industries Rely on Geodata Insights?
Early forms of geospatial analysis date back to the 1850s, but commercial use really began to expand in the 1990s—and has only grown in recent years. Since then, every industry that interacts with the physical environment relies on geospatial analysis in some form.
- Meteorology: Weather tracking is a major end use for geospatial data.
- Environmental: Scientists draw on satellite imagery to observe changes in vegetation, erosion, the impact of human activity, and more.
- Fishing: Commercial fisheries track weather, climate patterns, and human activity that affect fish stocks.
- Agriculture: Farms use geodata to track crop spread, explore topography ahead of planting, and predict incoming weather.
- Forestry: Reductions in tree coverage are easily viewed on maps to support logging operations.
- Urban planning: Cities rely on GIS data for zoning updates and land-use approvals.
- Construction: Companies examine geospatial outputs for site planning, drainage patterns, topographical issues, etc.
- Mining: Mines collect satellite and drone imagery for exploration of new holdings and compliance with land-use regulations.
- Education: Students can review imagery to further their knowledge of geospatial relationships and their consequences.
- Intelligence: The National Geospatial-Intelligence Agency leverages geodata to observe border security, maritime activity, and international conflicts.
- Defense: Military actions rely on geospatial imagery to identify optimal routes of movement and potential areas of risk.

Geospatial analysts use data to determine areas of risk and paths of evacuation during floods.
How Machine Learning Transforms Geospatial Analysis
As in a lot of fields, machine learning has become an essential asset for supercharging the capabilities of GIS technicians and analysts. Tools like Striveworks' Chariot machine learning operations (MLOps) platform and the Sky Saber imagery toolkit employ computer vision, giving analysts much more power than static map-making.
Machine learning models trained on large geospatial datasets can identify complex patterns humans overlook—either because of the time required to process that data or because only algorithms can detect them. Models can automate tasks that GIS technicians take hours to execute manually, such as finding objects of interest in large-scale images. Automation can greatly scale the output of GIS teams.
Perhaps most critically, though, machine learning enables geospatial analysis to happen in near real time, even in dynamic environments. The speed, flexibility, and accuracy of machine learning allows analysts to deliver rapid outputs from geospatial data—empowering wholly new applications in weather tracking, transportation, or military engagements.
Here are some typical tasks that machine learning can perform for geospatial analysis:
- Object Detection: Models trained on appropriate geodata can easily identify common objects, such as roads, buildings, open spaces, bodies of water, vehicles, etc. This process can save technicians hours in manually tagging objects. Plus, it enables technicians to identify objects they may easily miss, such as a small boat in a large harbor. Machine learning also makes it possible to track objects from satellite imagery as they move in near-real time—a process that is too difficult for manual analysis but that can make a life-or-death difference in volatile situations, like evacuating from natural disasters.

Machine learning object detection models can identify factors of interest, such as the number and type of airplanes on an airfield. -
Clustering: With a clustering process, analysts can discover data points that belong to groups they may not even know exist. Algorithms like k-nearest neighbors or HDBSCAN assign data points to categories, which enables users to visualize the association between them. This has a range of uses—from identifying bird species in wildlife research to separating northbound and southbound traffic for transportation planning.
-
Endpoint Prediction: Machine learning can examine geospatial data for trends in object movement, drawing on historical data to forecast the destination for an object as it moves through the world. Analysts can use the results to assess everything from herd migration in ecological studies to suspects under criminal surveillance.
-
Classification: A classification model can instantly associate whole images to categories. This process can help geospatial analysts easily organize imagery for further study, such as separating an unstructured set of satellite images into spring, summer, fall, and winter collections.
-
Automatic Tagging: Any supervised machine learning process begins with an annotated dataset. But manually tagging image after image can take hours. Machine learning helps analysts prepare training datasets faster by auto-annotating entire images or objects in them. Algorithms can match untagged objects to examples that analysts have already tagged, filling in the blanks and saving hours of work to get datasets clean and ready for use.
Why Machine Learning Is a Critical Tool For Geospatial Analysts
While organizations have embraced geospatial data, the work needed to generate useful insights has traditionally fallen on analysts’ shoulders. Tagging objects of interest on satellite imagery or calculating optimal routes to a destination are major improvements over the way things were done in the recent past, but they still take hours of skilled analysts’ time and attention. Even then, they are prone to human error and limited in scope, especially in time-sensitive situations.
Machine learning is a tool that GIS technicians and other analysts can use to optimize their work. It lets them automate common tasks and gives them the ability to provide insights more rapidly in dynamic environments. With those capabilities, geospatial analysis becomes even more valuable—whether you’re planting a corn field, developing a strip mall, or evacuating residents from an oncoming hurricane.
Want to know how Striveworks empowers geospatial analysts with machine learning? Learn more about our Chariot MLOps platform and Sky Saber imagery toolkit by scheduling a demo today.